Welcome back to MLBMA betting. Thanks for reading, following along and interacting on Twitter @MLBMovingAvg. Let’s keep this monster season rolling.
MLBMA Offensive Breakdown
SD Away vs RHP, 2019 (Last 14)
- 177 PA
- .207/.239/.355 Triple Slash
- .594 OPS
- .148 ISO
- .250 wOBA
- 50 wRC+
- 29.9% K Rate
- 3.4% BB Rate
- 32.5% Hard Hit Rate
SF Home vs LHP, 2019 (Since 8/1)
- 158 PA
- .324/.369/.510 Triple Slash
- .880 OPS
- .186 ISO
- .369 wOBA
- 132 wRC+
- 13.9% K Rate
- 6.3% BB Rate
- 44.4% Hard Hit Rate
Technical Analysis for SF

SF has been erratic from a technical standpoint, but we cannot ignore how often they have found baseline support at their varying Moving Averages. Last night’s regression stopped right at their MAs, and we’ll be looking to buy that dip this afternoon. We should catch a rip up to mid .350s in terms of wOBA. This implies roughly five runs, which I believe will get it done vs the Friars.
MLBMA Starting Pitching Breakdown
Eric Lauer Away, 2019 (12 Games Started)
- 57.2 IP
- 5.93 ERA / 4.49 FIP / 4.60 xFIP
- 1.46 WHIP
- 55 K : 20 BB
- .278/.340/.452 Triple Slash
- .792 OPSA
- .333 wOBA
- 45.5% Hard Hit Rate
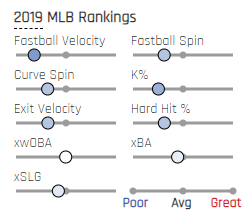
- Poor Statcast Data (Below)

Jeff Samardjiza, 2019 (Last 7 Games Started)
- 41.1 IP
- 1.52 ERA / 3.97 FIP / 4.69 xFIP
- 0.85 WHIP
- 30 K : 13 BB
- .156/.227/.262 Triple Slash
- .489 OPSA
- .217 wOBA
- 36.9% Hard Hit Rate
MLBMA L14 Bullpen Breakdown
| Tm | IP | ERA | wOBA | K-BB% | WHIP | FIP | xFIP |
| SDP | 55 | 2.78 | 0.285 | 17.60% | 1.27 | 3.11 | 3.87 |
| SFG | 36 | 5.75 | 0.337 | 3.70% | 1.53 | 5.11 | 5.82 |
The MLBMA Play : SF F5 ML (-130)
SD has a decided edge across the board as far as bullpens. Therefore I’m betting the SF F5ML. I’ll also be getting some exposure to the -0.5 RL (+105).
NOTE: CONSIDER ALWAYS MOVING (-) RL PLAYS TO ML FOR PARLAYS, AND UNDERDOGS TO +0.5 FOR PARLAYS
TODAY IS AT STANDARD 1.0% RISK
SCROLL DOWN FOR DAILY BETTING STRATEGIES FOR SOME IDEAS ON HOW TO TACKLE TONIGHT’S PLAYS.
General Betting Risk Strategy
I often get questions about betting strategy and it all starts with proactively determining how much I’m going to bet and then working backwards when applying that to my plays on a percent basis.
My daily allotted risk (R) shifts with performance. I have found that reducing bets during down times helps greatly in protecting capital. To be more specific, my standard is a risk of R=1% total stack. After a winning day it goes to 1.5%, and caps at a max 2% after two wins in a row. I do the opposite as well. I remain at 1% if there are two losing days, and reduce to a capped minimum of 0.5% for the third.
Tailor your game to your own account and expectations. I bet small relative to stack, and bet smart. If you can’t make money with $100, what makes you think you’ll make money with $10,000?
I never risk more than 1% on any outcome, and never bet more than 2% on any given night. I scale those numbers down into losing streaks, and increase them again as the wins roll in.
Daily Betting Strategies for Three or Less Plays
I’d like to share a few of my fallback plans on playing strategy in case I don’t get to a specific plan on a given night. If a bet is at or close to even, bet it straight. We want to avoid pairing action as much as possible. Sometimes the odds make this unavoidable. Whenever I have two heavy favorite picks, I will pair them. If I have three favorites, I play a small ABC F5ML parlay, and then play all three F5RLs straight, but of course it always depends on the specific odds that day. I do not like to pay any juice beyond -200. I would never play those straight. We must pair, or fade. Any team can win on any day.
Daily Betting Strategies for Four or More Plays
Whenever I have four picks, I’m usually going to play a Round Robin where 3 of 4 hits will guarantee a nice percentage profit, and all 4 is huge night on a relatively small risk. I also always take a small percentage of daily risk on a four game parlay.
If there are ever more than four plays, I compartmentalize the picks, and then follow one of the plans above. A good starting point is playing any underdogs straight. Then either pair by length (F5/FG), or by time of day. It’s always a good idea to separate the later games to allow for chances to hedge and guarantee profit.
A Quick Intro to MLB Moving Averages
MLBMA incorporates proven methods of technical analysis, indicators and trading techniques towards the current MLB betting space. I created some custom stats to encompass all the prerequisites, and most importantly save us all a ridiculous amount of time. Therefore, a team receiving high grades in Offensive Runs Created (ORC+) or Pitching Runs Allowed (PRA+) have already passed rigorous standards on combinations of weighted averages, trend & split tests.
To list all pertinent stats individually is a waste of precious time we just don’t have in a nonstop, 24/7 MLB market. Also if you’ve been following along this season, you have an idea of how I structure of my statistical arguments. Please feel free to refer to the earliest articles on my author page https://windailysports.com/author/mlbmovingavg/ to see some of these metrics walked out in more detail.
Ultimately my goal is to provide you instantly with the most comprehensive & unique betting snapshot of any given MLB slate. I want it to cater to those serious players without tons of time to do their own data mining, and be immediately effective across all formats. MLBMA is a 24/7 profit mindset. This type of system requires only the most disciplined, intelligent and thinking players; Those determined to provide sustainable income over the long haul.
A very special thanks to https://fangraphs.com (where I’m good for at least twelve million clicks a season) for helping me scrape and mine this data to determine all of these formulas .
Let’s get it.


